The Price Evolution of Bitcoin isn't RANDOM
Using Mathematics to Analyse Bitcoin
Finding Future Bitcoin Reversal Points
Success Stories
Mathematics
13 years ago someone told me ‘the Price of Financial Assets moves according to Mathematics’. He had no proof but some things which he showed me suggested that it could be true. I tried to prove it to be true for more than 10 Years. I tried everything which I could think of. Some ideas seemed promising but never stood up to live testing. It made me recall Thomas Edison when he was trying to invent the Electric Light Bulb. ‘I am not a failure,I have just found 10’000 way’s which don’t work. Then at the start of 2022 I found something which changed everything.
It was a way to calculate future High and Low Points based on previous Highs and Lows. I found that there is a Mathematical Relationship between these points.
This method works with Assets as diverse as GBP/USD, Natural Gas, Nasdaq 100, Tesla, Crude Oil and BITCOIN.
I am not going to explain how my method works, as it's taken me over 10 years to find this.I have created a Private Indicator Tool on TradingView which I call Graycell and this allows me to make the calculations quickly. Previously all the calculations were done manually and took some time. It allows me to use Hourly Charts to benefit from Intraday moves. You can see some examples of my previous analysis for various assets at on my X Account.
Analysis
.
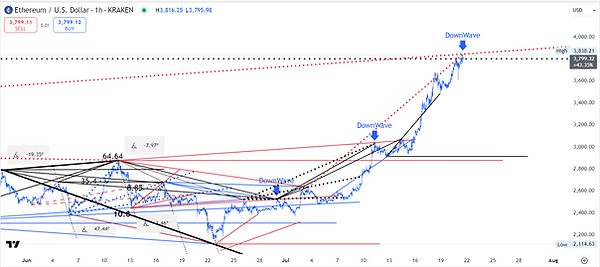
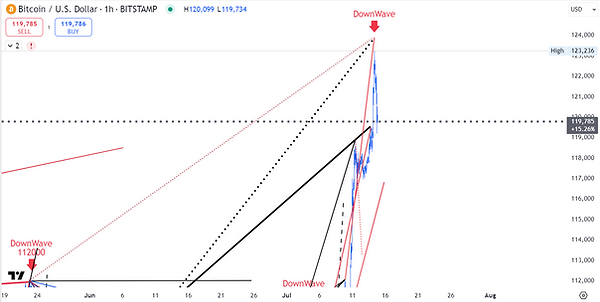
I found that Assets have their own Velocity by which they rise and fall. I am finding Points where this Velocity changes. This is usually a High or a Low Point but it can also be where there is a clear change of direction ( Acceleration or Sideways ). I use my method to find Future Points where you can take a Position. Usually, these points are told in Advance and you can watch the Price development to see if the Price approaches that point. As it is Mathematical, the Future High and Low points tend to be accurate. I use the same method in short term and long term analysis.
Each line which you see on the Chart is a calculation. It is the same calculation method irrespective of the Asset. I found that my method works really well with Bitcoin, but actually it works with all Assets. It is easier to see however with assets which have a large degree of Volatility. Bitcoin was therefore a perfect choice for this website.
.
Information
Please feel free to use the Information on this website in any way you wish. I am not offering any advice. However, I am willing to make my method available to a small number of interested parties.
All information is provided in good faith.
You can contact me at graycell888@gmail.com
Cnut Trading System
This is the name which I chose for my method of Analysis as it reminded me of King Cnut trying to Stop the Waves. As my method developed and I saw many times where the Price approached my Calculation Line and then reversed it seemed like I could Stop the Waves. Of course it's all down to Mathematics I don't have any more 'powers' than King Cnut.
Cnut The Great
First Viking King of England trying to
Stop the Waves
Stop the Waves

2025 Opportunities from x.com/Graycell888